Published in Malay Mail, Astro Awani, Business Today, Malaysiakini, Malaysian Insight, New Straits Times, theSundaily, and Asia News Today, image by Malaysiakini.
Although the current inflation rate in Malaysia is claimed to be “lower” than the world average and remains “under control”, it doesn’t actually reflect the reality of ordinary Malaysians who continue to suffer from rising food and fuel price inflation.
The Department of Statistics Malaysia (DOSM) stated that the Consumer Price Index (CPI) – which measures the rate of change in the cost of purchasing a constant basket of goods and services by households in a specified time period – increased to 2.3% year-on-year (y-o-y) from 123.1 in April 2021 to 125.9 in April 2022.
Officially, Malaysia’s CPI is lower than countries like India, the US, the UK and Singapore – at 7.04%, 8.6%, 9.1% and 5.6%, respectively. However, the ongoing fuel subsidy together with the other subsidies and price ceiling/control measures, etc. would have contributed to ensuring that actual inflation in Malaysia is lower than otherwise would be.
As producers have to bear the brunt of price increases from feed ingredients and labour shortages, this has translated into a double-digit percentage rise in the Producer Price Index (PPI) at 11.0% in April 2022.
PPI measures the prices of goods at the factory gate, i.e., finished products but minus transport/logistics and other post-production charges such as wholesale, distribution and marketing.
This by itself is an indicator that – even minus the logistics and transport costs – food inflation should realistically be much higher.
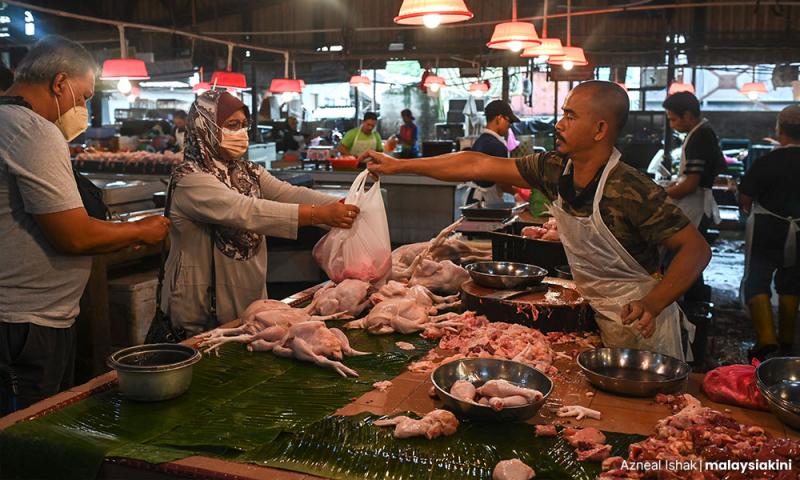
In substitution of the price ceiling adjustment/variation for chicken and eggs as well as the removal of subsidies for cooking oil in bottles of 2kg, 3kg and 5kg from July 1 onwards, the government will provide additional Bantuan Keluarga Malaysia (BKM) cash assistance to the B40. An additional RM630 million of cash assistance is to be diverted from the original RM729 million subsidy for chicken farmers whereby an additional RM100 and RM50 will be set given for B40 households and singles, respectively. However, this wouldn’t be a sustainable solution to alleviate the cost-of-living concerns of the rakyat in the long run.
The question is how long would such a paltry cash allowance last for the B40 who spent a minimum of 25% of their disposable income on food and non-alcoholic beverages even before the Covid-19 pandemic?
According to the DOSM’s Household Expenditure Survey Report 2019, the B40 allocated more from their income to spend on food and beverage items compared to the M40 at 18% and the T20 at 12.6%.
With the heightening food price inflation in recent months, the B40 could well have been spending more than 50% of their income on food items alone.
The middle to upper M40 are also a vulnerable income group since their spending patterns are comparable to the B40 in relation to food consumption. In short, inflation has also eroded their purchasing power since their wages haven’t kept up. They also tend to not have sufficient cash buffer or savings relative to their income unlike the T20 group. Since the middle and upper M40 lack access to cash assistance, will we see more Malaysians experience cash flow problems or otherwise tighten their belts (and thereby see a decline in living standards)?
Already the DOSM’s Household Income Estimates and Incidence of Poverty Report (2020) revealed that around 20% or 580,000 households fell from the M40 to B40 income category in 2020.
Now that a basket of groceries that initially cost only RM79.90 in 2010 have gone up to RM100 in April 2022, the household purchasing power had decreased by 20.1% according to chief statistician Datuk Seri Mohd Uzir Mahidin (see “Special Report on The State of The Nation: Why CPI is low even as rising costs bite”, The Edge, June 20, 2022).
This is why it’s so important revisit our CPI and ensure that it’s more reflective of the reality on the ground.
In addition to the policy proposals outlined in EMIR Research article, “Re-envisioning the CPI” (May 12, 2022), we would like to further provide additional suggestions:
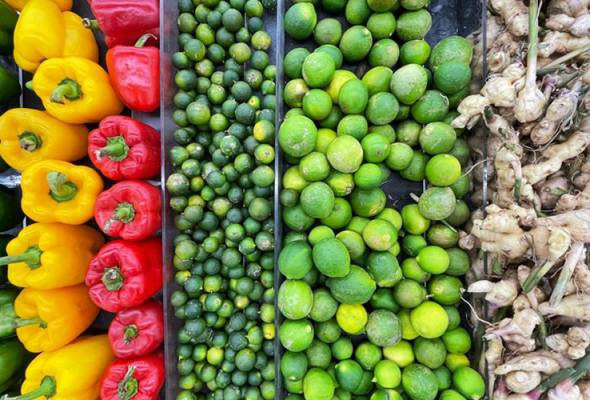
- Formulate a separate Food Price Index (FPI) as the secondary headline inflation to the CPI. Like the CPI, the FPI comprises several sub-indices – vegetables, poultry, fish, (red) meat, fruits, eggs, etc. So, the FPI will comprise several sub-index lines (analogous to the tariff lines under the World Trade Organisation or WTO) but devoid of the non-food items.
Since the B40 and the lower M40 typically spend between 25% to 30% and above of their disposable income on food and groceries per month, a FPI is warranted and would be a more important indicator to assess the impact of rising prices on the majority of the rakyat.
Now, each of the sub-indices in turn would be divided into the two categories based on the per capita consumption (PCC), i.e., most popularly consumed and less popularly consumed items, for example.
The two categories under sub-indices will, therefore, be calculated separately and the weighted average will be driven by and mainly derived from the most popularly consumed category.
So, for example, to calculate the sub-index for vegetables, we first determine the weighted average of the price increase for the most popularly consumed vegetables on a weekly basis which is let’s say 5% for Week 1. The less popularly consumed vegetables are at 11% for the same Week 1.
The above weighted averages of the price increases for the FPI are best derived from a single national supply chain data management platform linking the suppliers of agrofood inputs, small farmers, local agri-techpreneurs and retailers together on a network. EMIR Research has long advocated the creation of such a platform.
Combined with the national data aggregation platform – while eliminating the middlemen – would empower small farmers to collectively bring their agricultural produce to the local markets at reduced prices. On top of that, this platform can become a powerful vehicle for data collection in order to inform policy decision-making process, including inflation calculation.
Once the weighted averages of the price increases are determined (5% and 11% in our example above), the weighted average for the vegetables sub-index then would be calculated as:

As for the weightage allocation, DOSM should conduct regular (e.g., semi-annual) surveys (e.g., based on stated preferences) to find out about the composition of the food consumption patterns and related-behaviour of Malaysians. So, perhaps based on the frequency distribution for the consumers’ responses, vegetables that are most popularly consumed could be assigned 70% weightage with the less popularly consumed vegetables at 30% based on the weekly food consumption pattern and propensity to spend of the rakyat.
This in turn could be combined with the geometric average calculation like the Jevon Index – where the price increases over few consecutive weeks (for example, 4 weeks to arrive at the monthly sub-indices figures) are multiplied together and the nth root is taken as the average of the weekly increases (i.e., the “central tendency” or “common denominator”) and where n is the number of increases.
To ease the re-formatting of the methodology, perhaps the next base year should be 2023.
- The National Action Council on Cost of Living (NACCOL) to focus on and spearhead initiatives aimed at expanding other secondary or tertiary headline inflation indices – which can be according to the respective clusters, i.e., health, education, housing, transportation, utilities and e-commerce, in addition to food.
This follows the announcement by Prime Minister Dato’ Sri Ismail Sabri of a new special five-member committee on tackling accelerating inflation to be chaired by Minister of Communications and Multimedia Tan Sri Annuar Musa.
What the government needs to do is to constantly and consistently assure the rakyat by ensuring that there’s transparency (and therefore accountability) in the methodology process of computing the CPI, etc. This definitively includes the need to disclose the underlying methodology and formulas on DOSM’s website (“technical notes”) – going beyond the calculation of the CPI in terms of the percentage of change and “headline” methodology.
The tension between the CPI and real-world inflationary pressures needs to be addressed and resolved – so that the credibility and legitimacy of the government’s policy formulation and implementation can stand the test of the rakyat’s confidence and trust.
Jason Loh and Amanda Yeo are part of the research team of EMIR Research, an independent think tank focused on strategic policy recommendations based on rigorous research.
Diterbitkan oleh The Malaysia Insight dan Berita Harian.
Walaupun kadar inflasi di Malaysia dikatakan “lebih rendah” daripada purata dunia dan kekal “terkawal”, ianya tidak menggambarkan realiti pengalaman rakyat yang terus terhimpit akibat kenaikan inflasi harga makanan dan bahan api.
Jabatan Perangkaan menyatakan bahawa Indeks Harga Pengguna (CPI) – yang mengukur kadar perubahan dalam kos perbelanjaan bakul barangan dan perkhidmatan oleh isi rumah dalam tempoh masa tertentu – meningkat kepada 2.3 peratus tahun ke tahun daripada 123.1 pada April tahun lalu kepada 125.9 pada April tahun ini.
Secara rasminya, IHP Malaysia lebih rendah berbanding dengan India, Amerika Syarikat, United Kingdom dan Singapura yang masing-masing berada pada 7.04, 8.6, 9.1 dan 5.6 peratus.
Walau bagaimanapun, subsidi bahan api, subsidi yang lain serta siling atau kawalan harga sudah tentu telah menyumbang kepada memastikan bahawa inflasi sebenar di Malaysia ialah lebih rendah daripada apa yang sepatutnya.
Memandangkan pengeluar terpaksa menanggung beban kenaikan harga makanan ternakan dan kekurangan buruh, ini telah mengakibatkan peningkatan peratusan dua digit dalam Indeks Harga Pengeluar (PPI) ke 11.0 peratus pada April.
PPI mengukur harga barang pada pintu masuk kilang iaitu produk siap tetapi mengecualikan kos pengangkutan atau logistik dan caj pasca pengeluaran lain seperti pemborongan, pengedaran dan pemasaran.
Ini menunjukkan bahawa walaupun tanpa kos pengangkutan atau logistik, inflasi makanan sepatutnya jauh lebih tinggi.
Bagi menggantikan pelarasan harga siling dan variasi ayam dan telur serta pemansuhan subsidi minyak masak dalam botol 2kg, 3kg dan 5kg mulai Julai 1, kerajaan akan menyediakan bantuan tunai tambahan kepada isi rumah B40.
Bantuan tunai tambahan RM630 juta akan dialihkan daripada subsidi asal RM729 juta yang dahulu diperuntukkan kepada penternak ayam di mana tambahan RM100 dan RM50 akan diberikan kepada isi rumah B40 dan bujang masing-masing.
Namun begitu, ini bukan penyelesaian yang mampan untuk mengurangkan kesengsaraan kos sara hidup rakyat dalam jangka masa panjang.
Persoalannya ialah berapa lama elaun tunai yang kecil itu boleh bertahan bagi isi rumah B40 yang membelanjakan sekurang-kurangnya 25 peratus daripada pendapatan untuk makanan dan minuman bukan alkohol sebelum wabak Covid-19 lagi?
Menurut Laporan Tinjauan Perbelanjaan Isi Rumah Jabatan Perangkaan 2019, isi rumah B40 memperuntukkan lebih banyak daripada pendapatan mereka untuk makanan dan minuman berbanding isi rumah M40 pada 18 peratus dan isi rumah T20 pada 12.6 peratus.
Dengan peningkatan inflasi harga makanan dalam beberapa bulan kebelakangan ini, isi rumah B40 sudah mungkin membelanjakan lebih daripada 50 peratus pendapatan mereka untuk makanan.
Isi rumah M40 atasan dan pertengahan juga merupakan kumpulan pendapatan yang rentan kerana corak perbelanjaan mereka setanding dengan B40 dalam penggunaan makanan.
Pendek kata, inflasi telah menghakis kuasa beli mereka kerana gaji tidak meningkat.
Tidak seperti kumpulan T20, mereka juga biasanya tidak mempunyai simpanan tunai yang mencukupi berbanding dengan pendapatan mereka.
Memandangkan isi rumah M40 pertengahan dan atasan tidak mempunyai akses kepada bantuan tunai, adakah kita akan melihat lebih ramai orang menghadapi masalah aliran tunai atau terpaksa mengetatkan tali pinggang mereka yang sejurusnya membawa kepada penurunan taraf hidup?
Laporan Anggaran Pendapatan Isi Rumah dan Insiden Kemiskinan (2020), Jabatan Perangkaan telah menunjukkan bahawa sekitar 20 peratus atau 580,000 isi rumah jatuh daripada kategori pendapatan M40 kepada B40 pada 2020.
Sebakul barangan runcit yang berharga RM79.90 pada 2010 telah meningkat kepada RM100 pada April tahun ini yang bermakna kuasa beli isi rumah telah menurun sebanyak 20.1 peratus, mengikut ketua perangkaan negara Datuk Seri Mohd Uzir Mahidin.
Itulah sebabnya penting untuk menyemak semula CPI dan memastikan ia lebih mencerminkan realiti di lapangan.
Jason Loh Seong Wei & Amanda Yeo merupakan sebahagian daripada pasukan penyelidik di EMIR Research, sebuah organisasi pemikir bebas yang berfokuskan kepada pencernaan saranan-saranan dasar strategik berteraskan penyelidikan yang terperinci, konsisten dan menyeluruh.