Published in Astro Awani, The Malaysian Insight, and The Malaysian Reserve image by Astro Awani.
The Consumer Price Index (CPI) is designed for the sake of the non-government sector (households and the general citizen) and hence the “consumer”. It’s the “headline” inflation aimed at the masses. The CPI is the measure of inflation that comes to immediate attention and which ought to be, therefore, of utmost concern because the items included therein has the most impact on our daily expenditure.
It’s also otherwise informally known as the cost-of-living index – as the items reflect the typical expenditure or “bill” of a household (in a year).
In addition to the CPI, there’s also the Producer Price Index (PPI) for businesses which measures the prices of goods at factory gate (i.e., finished products but minus transport/logistics and other post-production charges such as a wholesale, distribution and marketing). Malaysia doesn’t have a wholesale price index (WPI) as in other countries like India. Therefore, the PPI would also substitute and “stand-in” for the WPI here. The Services Producer Price index (SPPI) tracks inflation in the services industry (like arts, entertainment and recreation).
As an index, both the CPI and the PPI tracks the changes in the price levels and, therefore, the percentage of inflation in a period or over time.
In turn, the changes in the price levels are based on a (predetermined) basket of goods and services. This means that the change (in the CPI) which is averaged out is derived from the average of the changes of the basket of goods and services – “(singular) average of the (plural) average(s)”.
Typically, the CPI can be divided into the main groups (or categories) and sub-groups (or sub-categories). This means that there’s an overlap between the CPI/headline inflation with core inflation – which excludes the volatile fluctuations in the former.
The determinants or factors of the CPI in Malaysia is as exhibited in Table 1 below – in the form of weightage assigned.
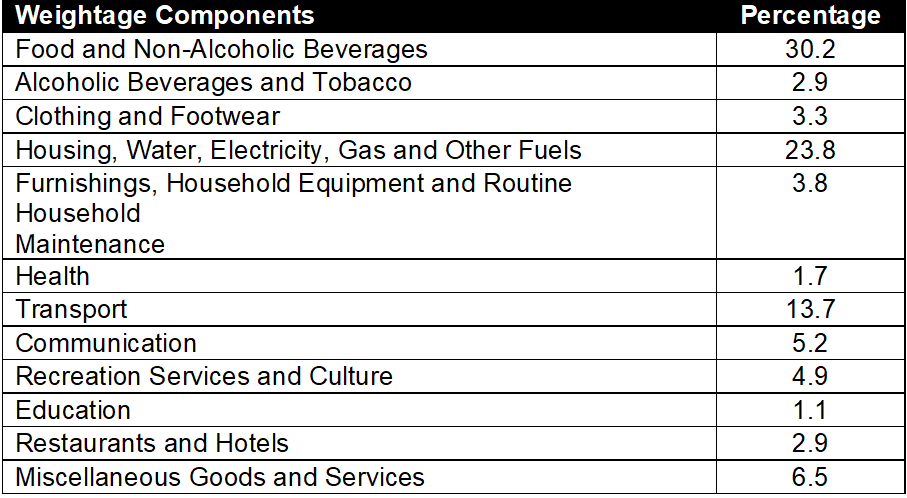
Table 1: Determinants of CPI in Malaysia
This is why it’s often the subject of controversy – since charges of inaccurate estimation often arises. As the national measure of inflation, the CPI is treated as under-stating the real inflation which for the person on the street could be three to four times more, anecdotally.
So, for example, if the CPI is said to be 2% on the whole, then real/real-world inflation is thought to be 6% or more as experienced by the average consumer.
Thus, there’s this discrepancy between what’s stated in the CPI and the lived experience of the consumer.
For example, let’s say that the hike in the prices of vegetables, poultry, fish and red meat have gone up by 15% on average (mean level) in March from last month but this isn’t reflected in the CPI – which only tracks “year-to-year” comparisons and hence the time lag.
Notwithstanding, on the surface, Malaysia’s CPI is no different than the rest of the world, including the developed countries. The difference would be in the weightage and percentage significance attached to the various items – as the following tables (of selected developed countries) show.
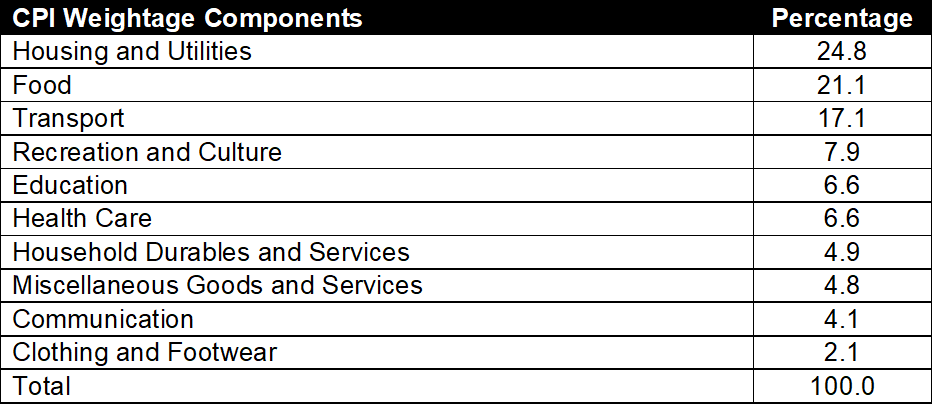
Table 2: Determinants of CPI in Singapore
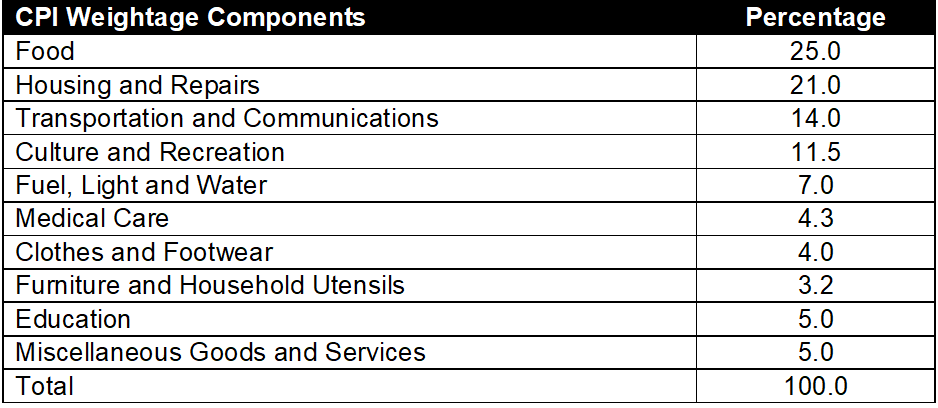
Table 3: Determinants of CPI in Japan
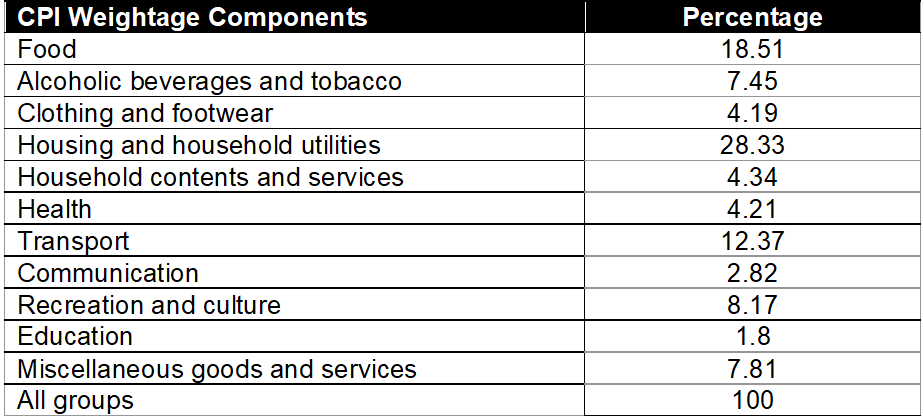
Table 4: Determinants of CPI in New Zealand
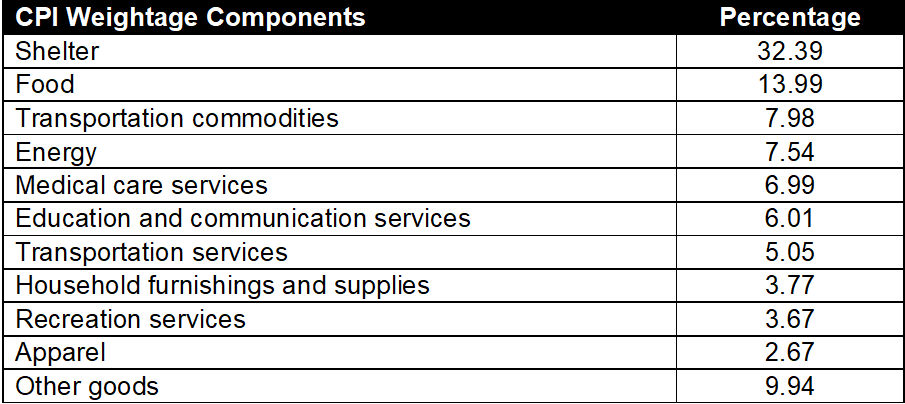
Table 5: Determinants of CPI in the USA
The dynamics and processes of calculating the formula is divided into the arithmetic and geometric.
The arithmetic is calculated based on either the:
- Laspeyres Index – for example, the basket of goods consists of a loaf of bread and a kilo of potatoes. Initially, they cost 50 sen each so the total cost is RM 1.00. Over the year, the price of bread increases by 4%, while that for potatoes increases by 8%. So, the bread costs 52 sen and the potatoes cost 54 sen – which means the basket of goods now costs RM 1.06 – in turn an increase of 6% representing a weighted average of 4% + 8%, respectively; or
- Paasche Index – for example, the basket of goods consists of a loaf of bread and a kilo of potatoes, again. At the base Year 1, they cost 50 sen each so the total cost is RM 1.00. In Year 2, the price of bread increases by 4%, while that for potatoes increases by 8%. So, the bread costs 52 sen and the potatoes cost 54 sen – which means the basket of goods now costs RM1.06. So, the CPI for Year 2 would be calculated as RM1.06 ÷ RM1.00 x 100 = 1.06%.
The geometric calculation, on the other hand, works on the basis that the price increases are multiplied together and the nth root is taken – where n is the number of increases.
Countries like New Zealand and the USA use the Jevons Index for the geometric calculation. Put it simply, the Jevons Index uses the nth root as the average – for arriving at the price increases and, by extension, the “central tendency” (i.e., the CPI average itself).
The various methodologies in calculating the CPI treats the very nature of inflation as heterogenous (rather than homogenous). That is, instead of a uniform inflation, we have different levels of simultaneous inflations.
Within the CPI itself, the average doesn’t indicate the underlying dynamics of the inflationary process whereby the price of one good may increase but the other may not (and in fact, decrease).
Moreover, price changes take place on a periodic basis within any year – subject to externalities such as e.g., supply-chain disruptions with which we are now so familiar with.
Inflation, therefore, is a dynamic rather than static process – which the CPI is unable to capture adequately.
Furthermore, the increase in the money supply whilst may result in inflation in one good/services or sector, but not necessarily apply to other sectors or goods/services.
And, of course, CPI works with the assumption of homogeneity of spending patterns across individuals and households, and holding the quantity and quality of the goods and services in the consumption basket as constant. It doesn’t take into account the external dynamics of impact on the purchasing power arising from loss of income, unemployment, under-employment, etc. that are characteristic of individual consumers and individual households.
Whilst rehauling the methodologies of the CPI to make it more reflective of the actual inflationary process is difficult given the complexity of the cost of living, we believe that measures can still be taken to promote the use/deployment of the CPI in a more transparent and accountable way.
Towards that end, EMIR Research would like to offer the following policy recommendations –
- To add the Wholesale Price Index (WPI) and Retail Price Index (RPI) and other such prices indexes that cover the entire supply chain, including an Import Price Index (IPI) also.
And then base the CPI methodology to include the related items in the related indexes in the supply-chain, e.g., vegetables in the WPI.
Meaning that the CPI will now take into account the costs of vegetables as measured by the WPI using a specific formula that’s broadly analogous to (cascading effect of) the GST (e.g., by adding a certain percentage).
At the same time, it also allows for the government to monitor for any “undesirable” convergences (i.e., spikes in both WPI and CPI) and any serious divergences (e.g., high WPI but low CPI).
- Re-envisioning the CPI as a purely policy (read: “political”) inflation rate (rather than “economic” as such).
This is because, as has been highlighted, the CPI is intrinsically unable to offer an accurate depiction of the cost-of-living due to the limitations concerned. Put in another way, coming up with a CPI methodology that reflects real-world dynamics and variables relating to the cost of living and, hence, with accurate precision is very difficult to undertake.
Instead, the CPI should require monetary policy to embark on a nominal GDP targeting – by “aligning” and “synchronising” the overnight policy rate (OPR) with the output gap (as measured by the rate of unemployment and under-employment as pointing to potential GDP) by using the CPI as an indicator.
This means that the CPI is used as one tool (in addition to the rate of unemployment, under-employment and wage growth, etc.) to “project” spare capacity in the economy (rather than future inflationary development as such) set against potential GDP growth next year.
If the CPI and GDP are at 2.5% and 5% this year, respectively, it means real GDP is only at 2.5% which is equivalent to the CPI. There’s a need and the room for the GDP to outpace the CPI.
With potential GDP growth projected to be higher at 6.5%, then there’s space for the OPR to remain low or even lower without the risk of the economy over-heating.
However, monetary policy on its own is either futile or unsustainable (relying on private debt and consumption) without fiscal policy as the main actor.
In conclusion, the methodologies regarding calculating the CPI can never be adequate precisely because the underlying definition of inflation is inadequate.
As such, the CPI needs to be re-envisioned for other policy purposes, i.e., at the macro-level other (or rather) than serving as a cost-of-living index, i.e., at the micro-level, as such.
Jason Loh Seong Wei and Rosihan Addin are part of the research team of EMIR Research, an independent think tank focused on strategic policy recommendations based on rigorous research.