
Published by AsiaNewsToday & AstroAwani, image by AstroAwani.
Malaysia ranked 36th among the 132 countries in the Global Innovation Index (GII) 2022, which may not seem bad at a glance, especially when it puts Malaysia 3rd among the 36 upper-middle-income nations.
Malaysia’s GII rank has generally worsened over the years, but relativity can mask true positioning.
Rankings appear to be fluctuating and Malaysia reached its lowest position in 2017 at 37th, then slightly improved to 33rd position in 2020 (Figure 1A). But this was still not at the 31st position where it was in 2011—the best position Malaysia achieved more than a decade ago, when the factors of production were still different (with a focus on simple factor accumulation rather than innovation), but things were just about to change radically.
Malaysia’s GII rank in 2021 worsened to 36 and remained at this level in 2022, the second-lowest since 2017. But, relative positions to different comparison groups can position Malaysia higher or lower.
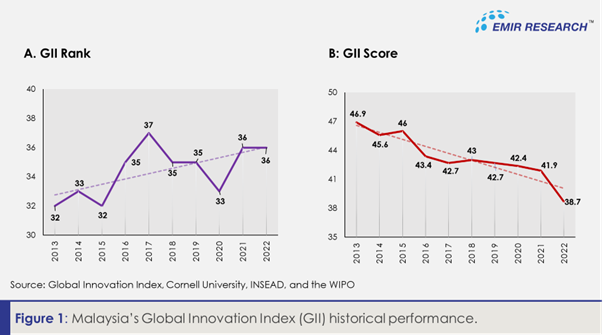
Again, ranks can be misleading and falsely comforting, while the score as an absolute measure reveals quite a different, alarming picture (Figure 1B), clearly showing that Malaysia has been in a steady and steep decline since 2013.
This is why a global score of the index provides a better (and realistic) picture of where Malaysia is—assuming the scores were done accurately. On this note, we explore specific variables to assess if Malaysia may or may not deserve its GII score.
Instead of going through all of the 81 indicators in GII 2022, let’s evaluate some of Malaysia’s supposed strengths and weaknesses identified by GII, as these impact Malaysia’s overall score and ranking the most.
The supposed strengths, in particular, can be the source of false comfort.
Under the market sophistication pillar, Malaysia ranked 11th in the market capitalization (as a percentage of GDP) sub-indicator, with a score of 117. Mathematically this is impacted by the size of Malaysia’s GDP, and it doesn’t show if the money flows into things that promote innovation.
However, Malaysia only scored 19.7% for the gross capital formation (GCF; as a percentage of GDP) sub-indicator, ranking it at a low 94th position. Since GCF is related to assets of the economy, this could indicate a lack of emphasis on building real infrastructure and the real economy, despite significant investment funding potential.
In other words, the infrastructure isn’t up to par to reap the full value of the financing and investment capacity.
Another indicator under the market sophistication pillar that Malaysia scored well on is credit. For example, Malaysia scored 60.6 (index score) for the sub-indicator of “finance for start-ups and scaleups”, ranking Malaysia 2nd globally in the GII.
But all these financing capabilities risk being severely underutilised if many of Malaysia’s research talents are not more represented in businesses, and not many businesses show interest in financing research and experimental development (R&D), measured as gross domestic expenditure on R&D (GERD).
Let’s take a leading nation in the lower middle-income and high-income groups as a reflection of where others might be fast catching up and where Malaysia should aspire to be, respectively.
Specifically, let’s take Vietnam (lower middle-income) given their consistent performance in GII (considered outperforming their GII score relative to economic development for the last 12 years in a row) and as a place seen to attract foreign direct investments (FDIs). We can take Singapore as an ideal benchmark in the high-income group.
Firstly, the appetite for R&D spending is different for top-performing countries such as Singapore, with a gross expenditure on R&D (percentage of GDP) of 1.9%, ranking it 19th, while it is 1% and 40th position for Malaysia.
Vietnam is lower at 0.5% and 59th position, but Vietnam has the highest percentage of GERD financed by business at 64.1%, ranking it highly at 10th position, whereas Malaysia is only at 38.2% and in the 45th position. Singapore is in between with 55.3% and 20th position.
Additionally, Malaysia scores 32.9 with a low 62nd ranking in the “knowledge worker” indicator (under the Business Sophistication pillar), with none of the sub-indicators categorised as a strength or an income-group strength by the GII.
This, in turn, negatively impacts the “credit” indicator under the “Market Sophistication” pillar, where Malaysia’s excellent score in the sub-indicators of “finance for startups and scaleups” and “domestic credit to the private sector” may not be fully utilised or maximised.
That said, it doesn’t mean Malaysia’s financing landscape is all good from the perspective of investments. Malaysia received zero scores for all three “venture capital” related indicators. In contrast, Singapore is the global leader in all three at rank number 1.
Anyhow, the true recipients of the financing resources are the knowledge workers. Companies need them to reap the full value of available financing.
This is why talent production (education system) and retention (opportunities, socioeconomic security and equity, political stability etc. to avoid “brain drain”) are crucial elements of the innovation ecosystem.
Education
A significant false comfort risk is Malaysia’s apparent high rank of 13th in the “Tertiary education” indicator and especially the “Graduates in science and engineering” (S&E; percentage) sub-indicator, where Malaysia ranked 3rd in the world.
Firstly, it is hard to consolidate this with a previously reported trend of a much higher enrolment in arts and commerce compared to sciences in Malaysia’s higher education institutions.
Secondly, how can we consolidate this with lowering science, technology, engineering and mathematics (STEM) enrolment in secondary school, high dropout rates and the overall low tertiary enrolment score in GII?
In this case, the percentage of graduate in S&E could be over-represented because of the lower number of graduates in other fields.
Most worryingly, low STEM enrolment and Program for International Student Assessment (PISA) scores in secondary school risk Malaysia churning out low-quality students, nullifying the impact of the high share of S&E graduates.
Singapore’s PISA scales in reading, maths and science scored 556.5, ranking 2nd in the world, with a gross tertiary enrolment of 91.1% with a ranking of 10th and a percentage of graduates in S&E of 35.4%, giving it a rank of 9th.
In contrast, Malaysia ranked 3rd in the world in terms of percentage of S&E graduates, but with a background PISA scales in reading, maths and science score of 430.9, ranking it at 48th, with only a 42.6% gross tertiary enrolment putting it at 74th ranking.
Is Malaysia churning out more share of S&E graduates at the cost of quality?
University Quality
Some may argue that quality shouldn’t be questioned given Malaysia’s good position for the sub-indicator of QS World University Rankings, being at the 16th position.
The QS ranking consists of three dimensions with varying weightage, namely academic peer review (40%), faculty/student ratio (20%), and citations per faculty (20%).
Academic peer review is the most controversial part of the methodology as it is based on an internal global academic survey which may be susceptible to personal perceptions.
The faculty/student ratio can also be problematic. For example, experts have noted how a low tertiary enrolment (note that Malaysia is ranked at a low 74th position in this sub-indicator) but with a higher number of faculties would give the impression of higher teaching commitment, when in fact, it’s a reflection of lower enrolment. Furthermore, it doesn’t show the quality of teachers and, therefore, the quality of the faculty.
As for citations per faculty, there is reportedly a “publish or perish” culture, where publication forms a central component of academic key performance indicators (KPI). Unfortunately, Malaysia ranked 5th in ‘fraudulent’ publications, according to a study by Machacek and Srholec in 2021.
The more citations a university has of its academics’ works in Scopus– a respectable global citation database of scholarly works – the greater its chances of improving its global ranking will be.
Notwithstanding criticisms of Machacek and Srholec’s findings regarding rigorousness and arbitrariness, the study indicated that Malaysia has the highest numbers of its academics cited in more than 300 predatory journals in Scopus.
So, the point remains whether these sub-indicators offer a good insight into the innovation ecosystem.
Be that as it may, the questions then are: Where do all these S&E graduates go? Which sectors are they employed in? Or are they contributing to a higher rate of underemployment?
Business Environment and Human Capital
Evidently, despite a higher percentage of S&E graduates, Malaysia’s density of researchers is 2184.7 full-time equivalent (FTE) per million population (ranked 38th), while Singapore has more than triple of Malaysia’s researcher density at 7,287.3, ranking it 5th in the world.
This could be due to Singapore’s higher percentage of knowledge-intensive employment, with a value of 59.9% (ranked 2nd), while Malaysia was only at 28.2% ranking it 52nd.
Consequently, Singapore’s score and rank for all indicators under the “knowledge and technology outputs” far outranks Malaysia, except for software spending (as a percentage of GDP) and ISO 90001 quality certs, where Malaysia ranks better than Singapore.
In other words, Malaysia appears to be relatively better in software spending and certifications, but the output is relatively lower.
This is a matter of efficiency, and focusing on the wrong things (certs) instead of substantial change. These are things that the “entrepreneurship policies and culture” sub-indicator considered by GII as an income-group strength for Malaysia may not be able to account for.
Even Vietnam scored a higher percentage of research talents in businesses at 24.1% (ranked 51st), compared to Malaysia at 15.8%, ranking 57th. Singapore is ahead at 52.2%, ranking 21st in this indicator.
Thus, although Vietnam’s current score and rank for the “human capital and research” pillar is lower than Malaysia, Vietnam appears to be utilising their research talents much better than Malaysia.
That said, Vietnam is still lacking in knowledge-intensive employment (as a percentage) at only 10.7%, putting it in the 106thposition, whereas Malaysia is at 28.2%, ranking 52nd. Singapore remains exemplary at 59.9%, ranking 2nd in the world.
Labour Productivity and FDI
Vietnam excels above both Malaysia and Singapore in the “labour productivity growth” sub-indicator, where it scored 5.6%, giving it the 3rd ranking globally, whereas Malaysia only scored 1% (ranked 62nd) and Singapore at 2.9% (ranked 18th).
Malaysia appears to score generally better and ranked higher in all dimensions of labour productivity, such as capital investment, technological progress, and human capital development. And yet, Malaysia’s labour productivity is nowhere near Vietnam, according to the GII.
In any case, certainly, the high growth in labour productivity, the higher percentage of research talents in businesses, the higher share of businesses that finance GERD, the relatively better university-industry collaboration and other factors could explain why Vietnam can achieve three times higher FDI net inflows (6.1% of its GDP) compared to Malaysia, putting in the 15th position.
Malaysia scored three times lower FDI net inflow than Vietnam at 2%, putting it at a low 72nd ranking position.
Thus, although Malaysia’s “Market Sophistication” and “Business Sophistication” pillars appear to be ranked better than Vietnam and the GERD amount by business (as a percentage of GDP) is higher than Vietnam, the proportion of Malaysian businesses has a lot more room to grow as financiers of GERD.
There is much need to boost innovation infrastructure, and Malaysian businesses must shift towards technology and innovation, fund more GERD, and hire more local talents.
Insufficient effort in doing so could lead to a poorer uptake of available credit facilities and a lesser pull factor from vast market capital, both of which Malaysia scored well in GII 2022.
High-tech exports
The next paradigm shift has to be moving beyond a heavy reliance on FDIs and foreign manufacturing in Malaysia. FDIs will indeed remain important, but the domestic innovation status and landscape call for increased net high-tech output, especially through the support of micro, small, and medium enterprises (MSMEs), which make up over 98.5% of businesses in Malaysia.
In other words, domestic output driven by homegrown innovations and local production has to be the key focus now, and in the future to move from a technology adopter to a technology producer.
However, Malaysia’s top global rank (1st) in high-tech exports (as a percentage of total trade) in GII 2022 is another false comfort risk.
This could be mainly driven by Malaysia’s electricals and electronics (E&E) industry.
The sector has grown with more innovative and advanced technologies, fuelled by technology transfers. The industry has diversified into various E&E manufacturing clusters throughout the country, and Malaysia has been ranked 7th in the global E&E exporters (World Trade Atlas), putting the country as a major global market player.
Malaysia’s E&E and manufacturing sectors are the country’s biggest export contributors. Yet, Malaysian companies are mostly in the upstream i.e., in the manufacturing of components, modules, systems, and for the service of electronic components and assemblies (EMS) for original equipment manufacturers (OEM).
Foreign companies dominate end-user products and equipment.
Malaysia greatly benefits during times of high demand for microchips and semiconductor cycles and a favourable commodity market, but Malaysia lacks downstream companies where the biggest value is created.
This is an example of a high-scoring component of the GII that may not fully translate into serving the objective of being a high-income nation.
Institutions
Interestingly, GII recognised almost all of the indicators under the “institutions” pillar as an income-group strength for Malaysia. For example, Malaysia received a score of 83.6 and ranked 16th for the sub-indicator of political and operational stability, and a score of 72.1 and ranked 29th for the sub-indicator of government effectiveness.
Of course, the country comparison within the income group could explain the ranks, but the scores could be an overestimation as political stability in Malaysia in 2022 was anything but stable, and effectiveness wasn’t the word usually associated with the government at that time.
Under the same pillar, the sub-indicators of “policies for doing business” and “entrepreneurship policies and culture”, Malaysia scored 62.2 and 62.5, ranking it 33rd and 20th respectively. Although GII considered these as an income group strength, Malaysia is not known to be deficient in having international standards and policies.
Therefore, evaluating policies but not its substantiveness and intricacies of policy implementation may not account for unseen realities and impacts of peer favouritisms, racial discrimination, political cronyism, the “know-who” in the entrepreneurship culture, or the impact of various cartels in many sectors and even government institutions.
These are indicative of the true underlying “culture” being practised that is not evident from studying policies on the surface level alone. For example, the hidden impact of “grant cartels” and “grant-preneurship” activities may limit who can benefit from the sub-indicator of “finance for startups and scaleups” which Malaysia ranks 2nd in the GII.
Therefore, GII’s recognition of almost all of the indicators under the “institutions” pillar as an income-group strength for Malaysia is another source of false comfort risk.
If anything, it takes excellent institutions to promote innovation and become a high-income nation. For example, Singapore scored the highest and ranked 1st in many indicators in the Institutions pillar.
Malaysia is good at coming up with policies and blueprints, but implementation remains an issue. Also, even though the GII methodology feature input and output pillars, outcomes and impacts are crucial measurement metrices. These are arguably severely lacking components for Malaysia.
We have also not delved into other indicators of successful innovation ecosystem such as rate of start-up success, number of true unicorns created and retained, patent filing trends and so on.
Clearly, innovation in Malaysia is declining and without serious course correction measures, Malaysia’s falling level of innovation reaches terminal velocity, hitting rock bottom instead of its 2030 and 2050 aspirations.
The outcomes and impacts of a poor innovation ecosystem go far beyond an index score and rank.
Dr Rais Hussin and Ameen Kamal are part of the research team of EMIR Research, an independent think tank focused on strategic policy recommendations based on rigorous research.